Home
About
Blog
Resources
Categories
All
(6)
Biostatistics
(1)
Data Visualization
(1)
Epidemiology
(1)
Geospatial
(1)
Infographic
(1)
MEDS
(3)
Python
(1)
Quarto
(3)
R
(3)
Workshop
(2)
Blog
My first blog post
Quarto
MEDS
Workshop
this is my short description
Hazel Vaquero
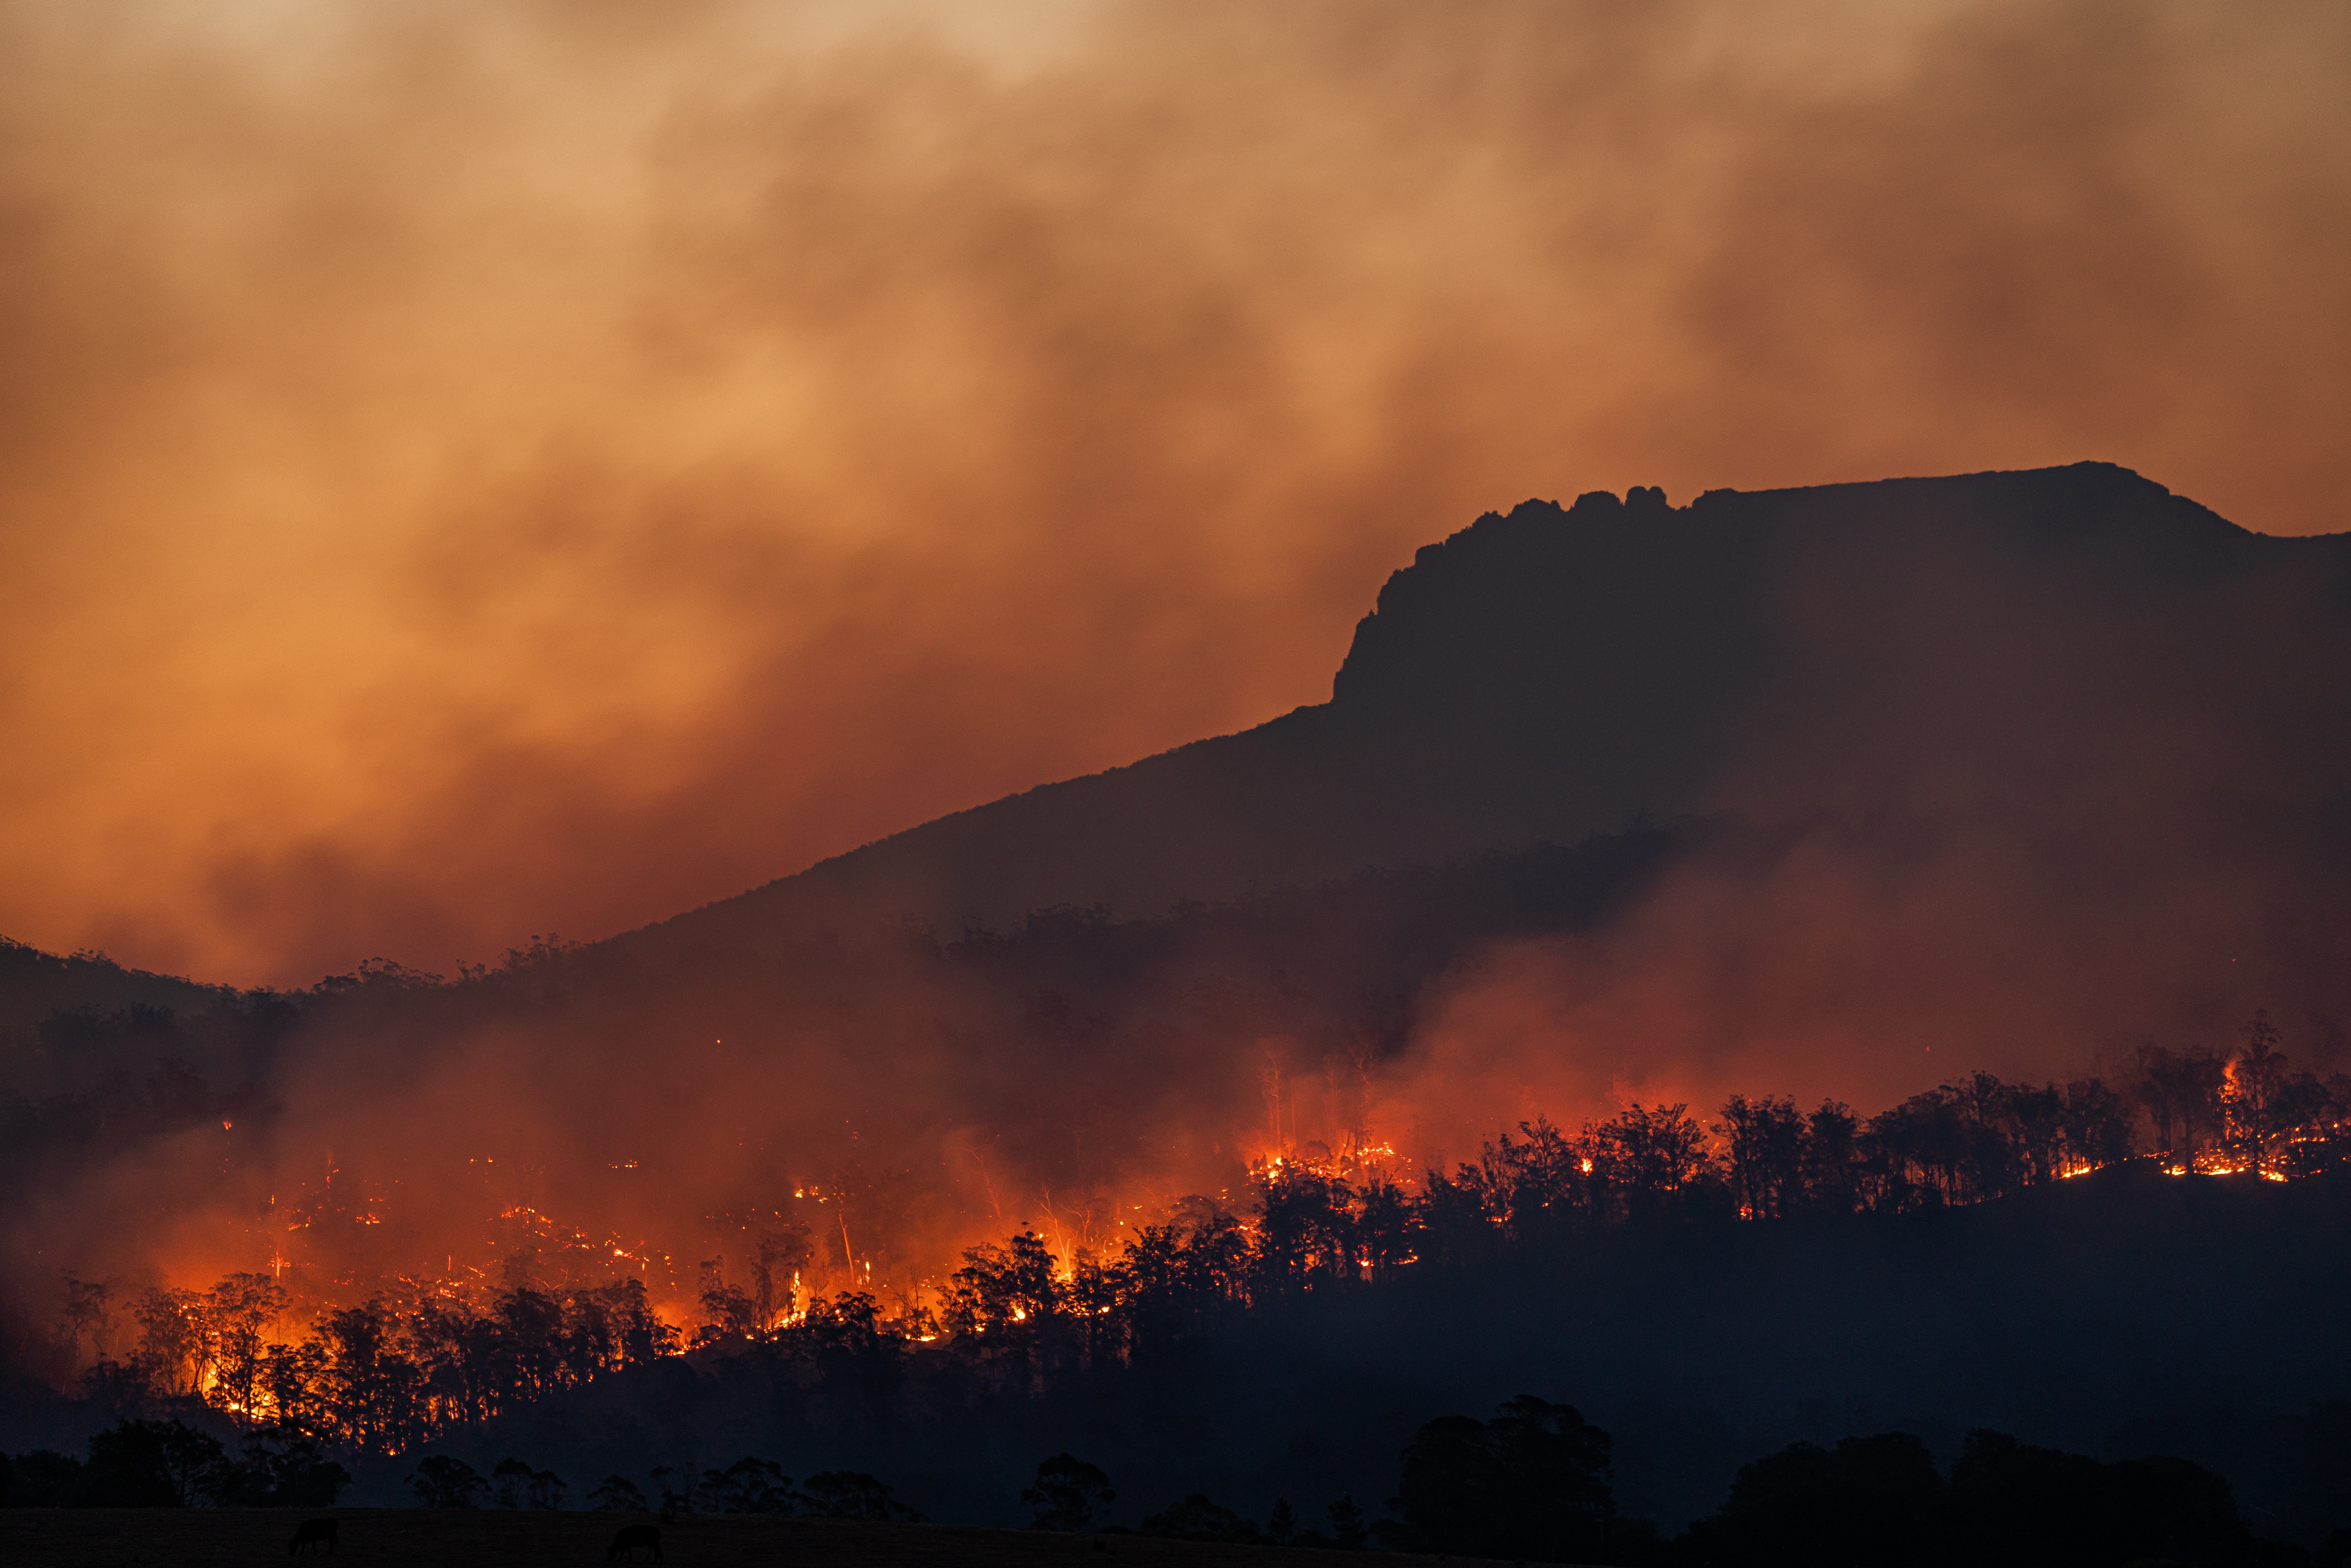
2021 Thomas Fire Air Quality Index and Fire Scar Analysis
Quarto
MEDS
Python
An analysis of Santa Barbara’s 2021 Thomas Fire, visualizing the scar the fire left. As well as analyzing the air quaility level at the time.
Hazel Vaquero
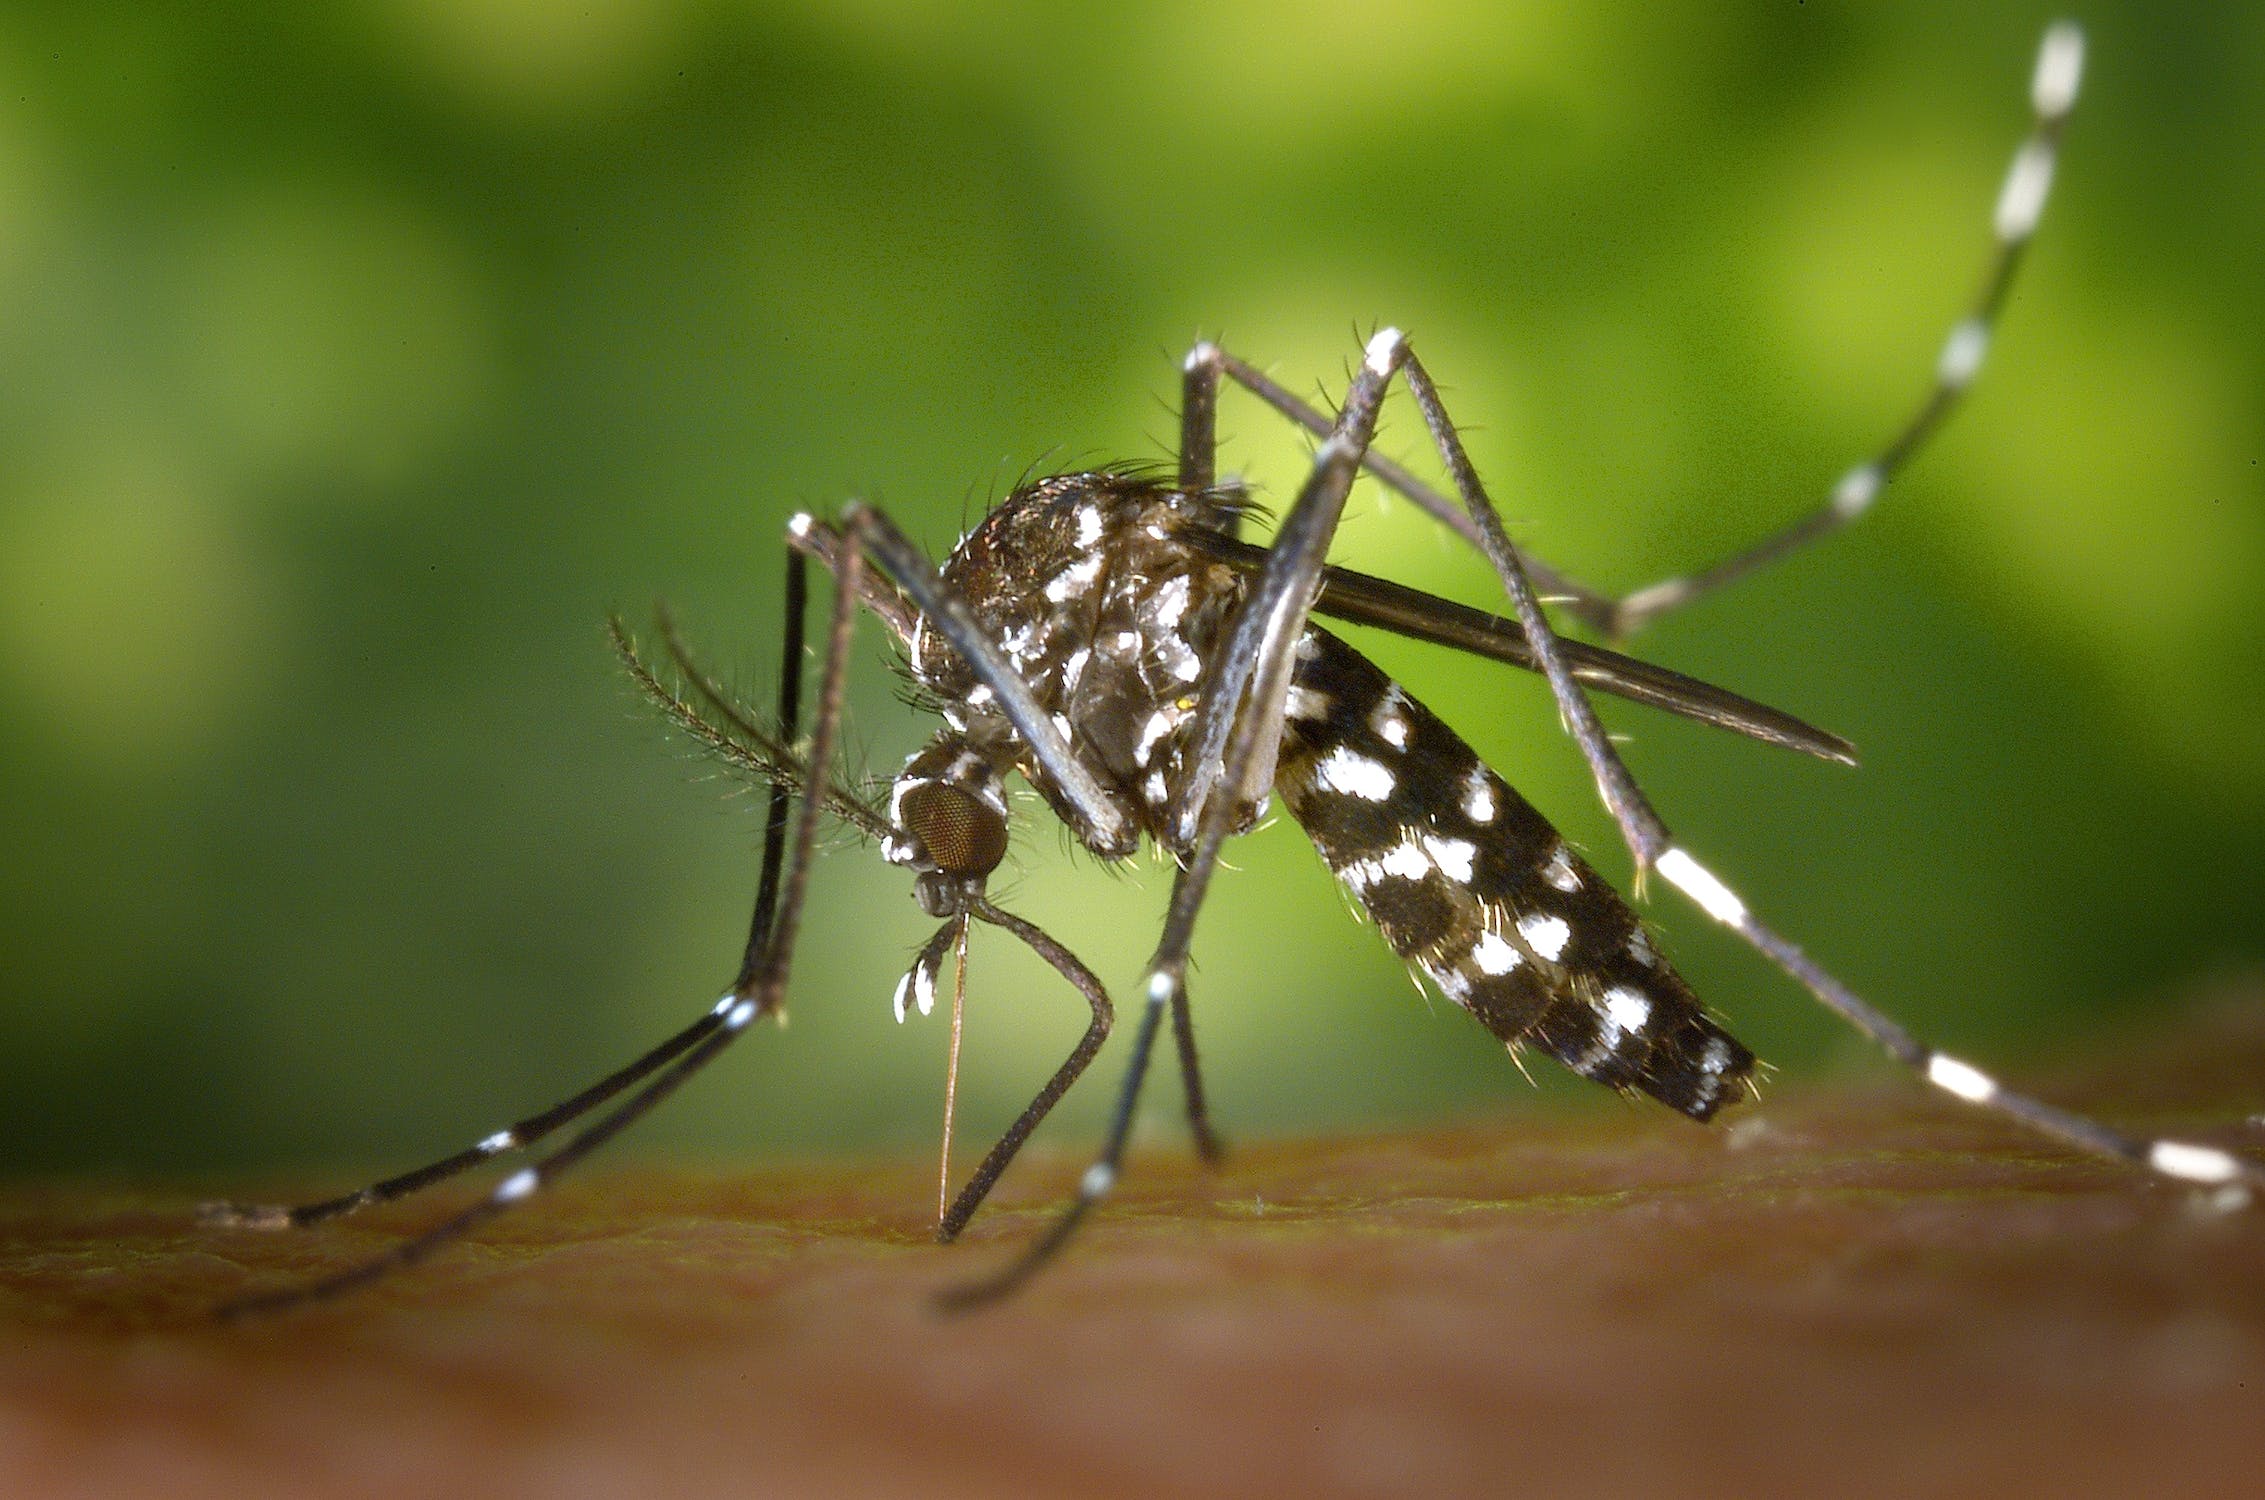
2021 Maricopa County - West Nile Endemic
R
Biostatistics
Epidemiology
Statistical analysis of the West Nile Virus endemic Maricopa County faced in 2021.
Hazel Vaquero
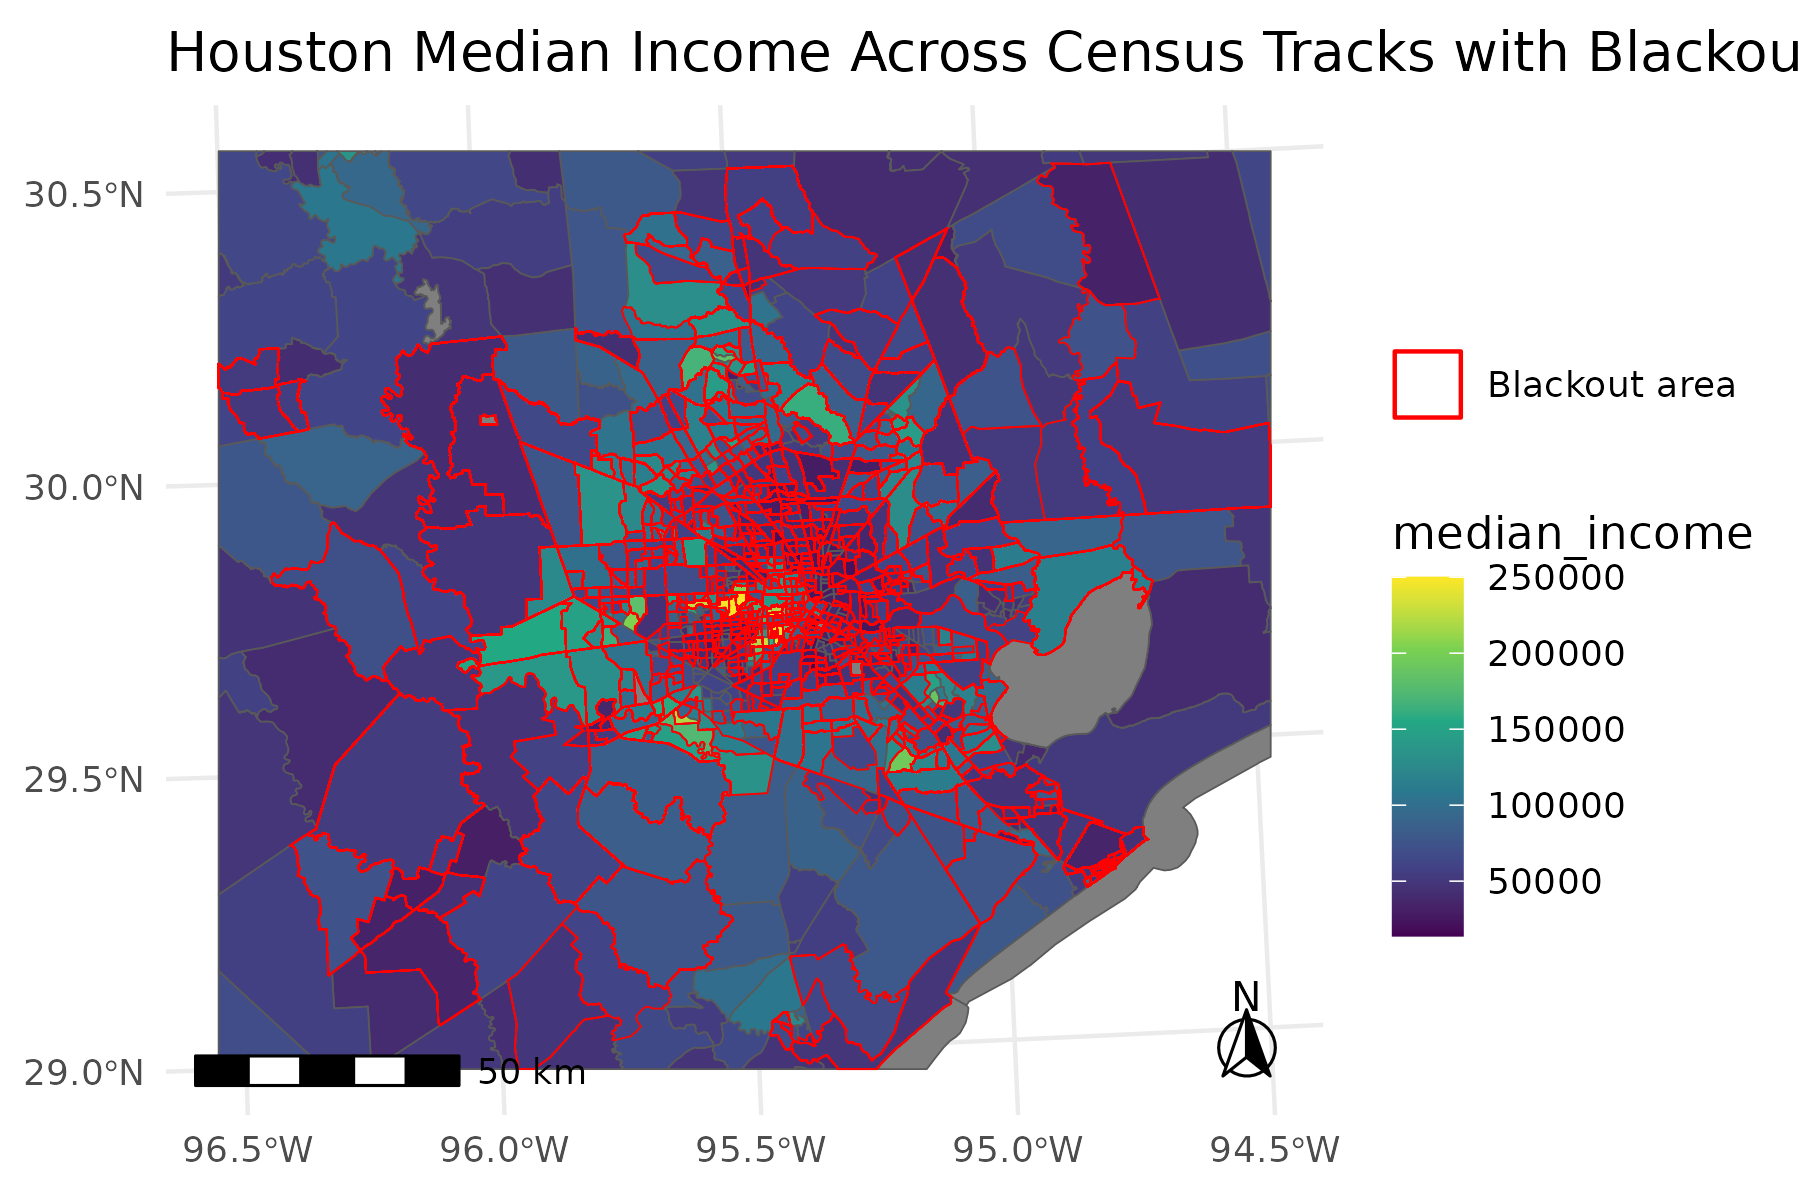
Houston 2021 Power Outage: Socioeconomic Analysis
Quarto
MEDS
Workshop
R
Geospatial
This is a geospatial anlysis of the 2021 Houston Power Outage that affected millions. I investigate if low income communities were disproportionately affected by the storm.
Hazel Vaquero
Visualizing NYC Dead Street Trees
R
Infographic
Data Visualization
In this blog I will show the steps I took to create an infographic analyzing New York City’s (NYC) street trees. My over arching question is
Are dead…
Hazel Vaquero
Access
We use the
Client
function from the
pystac_client
package to acess the catalog
No matching items